| Statistics | 2009 2010 2011 2012 2013 2014 | |
|---|---|---|
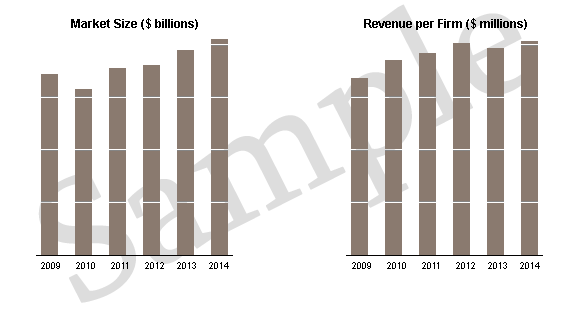
| Market Size (Total Sales/Revenue) |
Order at top of page |
|
| Total Firms | ||
| Total Employees | ||
| Average Revenue Per Firm | ||
| Average Employees Per Firm | ||
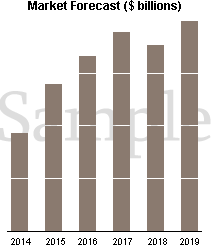
| Forecast / Industry Outlook | 2014 | 2015 | 2016 | 2017 | 2018 | 2019 |
|---|---|---|---|---|---|---|
| Market Forecast ($ millions) | ||||||
| Product Description | Sales ($ MM) |
Percent | Additional Information |
|---|---|---|---|
Nonwoven Fabric Mills |
|||
Nonwoven Fabrics |
|||
Nonwoven Fabrics, Wet Laid |
|||
Nonwoven Fabrics, Excluding Wet Laid |
|||
Nonwoven Fabrics, Not Categorized |
|||
Fabricated Nonwoven Products |
|||
Blankets, Wipers, And Ribbons, Made From Nonwoven Fabrics |
|||
Wipers, Made From Nonwoven Fabrics |
|||
All Other Fabricated Nonwoven Products |
|||
Fabricated Nonwoven Products, Not Categorized |
|||
Pressed, Punched, Or Needled Felts (Except Hats) |
|||
Pressed Felts, Except Hats |
|||
Punched Or Needled Felts, Hair And/Or Jute, Except Hats |
|||
Punched Or Needled Felts, Wool & Manmade Fibers, Except Hats |
|||
Pressed, Punched, Or Needled Felts (Except Hats), Not Categorized |
|||
Nonwoven Fabric Mills, Not Categorized, Total |
|||
Nonwoven Fabric Mills, Not Categorized, For Nonadministrative-Records |
|||
Nonwoven Fabric Mills, Not Categorized, For Administrative-Records |
|||

| Industry Average | Percent of Sales | |
|---|---|---|
| Total Revenue | Order at top of page |
|
| Operating Revenue | ||
| Cost of Goods Sold | ||
| Gross Profit | ||
Operating Expenses |
||
| Pension, profit sharing plans, stock, annuity | ||
| Repairs | ||
| Rent paid on business property | ||
| Charitable Contributions | ||
| Depletion | ||
| Domestic production activities deduction | ||
| Advertising | ||
| Compensation of officers | ||
| Salaries and wages | ||
| Employee benefit programs | ||
| Taxes and Licenses | ||
| Bad Debts | ||
| Depreciation | ||
| Amortization | ||
| Other Operating Expenses | ||
| Total Operating Expenses | ||
| Operating Income | ||
| Non-Operating Income | ||
| EBIT (Earnings Before Interest and Taxes) | ||
| Interest Expense | ||
| Earnings Before Taxes | ||
| Income Tax | ||
| Net Profit | ||
| Profitability & Valuation Ratios - Nonwoven Fabric Mills | Industry Average |
|---|---|
| Company valuation can be measured based on the firm's own performance, as well as in comparison against its industry competitors. These metrics show how the average company in the Nonwoven Fabric Mills industry is performing. | |
| Profit Margin Gross Profit Margin, Operating Profit Margin, and Net Profit Margin. Show company earnings relative to revenues. |
|
| Return on Equity (ROE) Return on Equity (ROE) is net income as a percentage of shareholders' equity. Shareholders' Equity is defined as the company's total assets minus total liabilities. ROE shows how much profits a company generates with the money shareholders invested (or with retained earnings). |
|
| Return on Assets (ROA) Return on Assets (ROA) is net income relative to total assets. The market research on Nonwoven Fabric Mills measures how efficiently the company leverages its assets to generate profit. ROA is calculated as Net Income divided by Total Assets. |
|
| Liquidity Ratios - Nonwoven Fabric Mills | Industry Average |
|---|---|
| Bankers and suppliers use liquidity to determine creditworthiness and identify potential threats to a company's financial viability. | |
| Current Ratio Measures a firm's ability to pay its debts over the next 12 months. |
|
| Quick Ratio (Acid Test) Calculates liquid assets relative to liabilities, excluding inventories. |
|
| Efficiency Ratios - Key Performance Indicators | Industry Average |
|---|---|
| Measure how quickly products and services sell, and effectively collections policies are implemented. | |
| Receivables Turnover Ratio If this number is low in your business when compared to the industry average in the research report, it may mean your payment terms are too lenient or that you are not doing a good enough job on collections. |
|
| Average Collection Period Based on the Receivables Turnover, this estimates the collection period in days. Calculated as 365 divided by the Receivables Turnover |
|
| Inventory Turnover A low turnover rate may point to overstocking, obsolescence, or deficiencies in the product line or marketing effort. |
|
| Fixed-Asset Turnover Generally, higher is better, since it indicates the business has less money tied up in fixed assets for each dollar of sales revenue. |
|
| Title | Percent of Workforce | Bottom Quartile | Average (Median) Salary | Upper Quartile |
|---|---|---|---|---|
| Management Occupations | 5% | Order at top of page |
||
| Chief Executives | 0% | |||
| General and Operations Managers | 2% | |||
| Office and Administrative Support Occupations | 9% | |||
| Installation, Maintenance, and Repair Occupations | 10% | |||
| Production Occupations | 62% | |||
| Textile Knitting and Weaving Machine Setters, Operators, and Tenders | 22% | |||
| Textile Winding, Twisting, and Drawing Out Machine Setters, Operators, and Tenders | 9% | |||
| Inspectors, Testers, Sorters, Samplers, and Weighers | 6% | |||
| Transportation and Material Moving Occupations | 8% | |||
| Company | Address | Revenue Estimate |
|---|---|---|
| Company | Federal Contracts | Total Award Amount |
|---|---|---|


Quanzhou Niso Industry Co.,Ltd is your best choice for diaper raw materials,feminine raw materials,nappy raw materials in China. We will offer high quality raw materials and machine, suggest customers produce good products to reach win-win is our purpose.


 IPv6 network supported